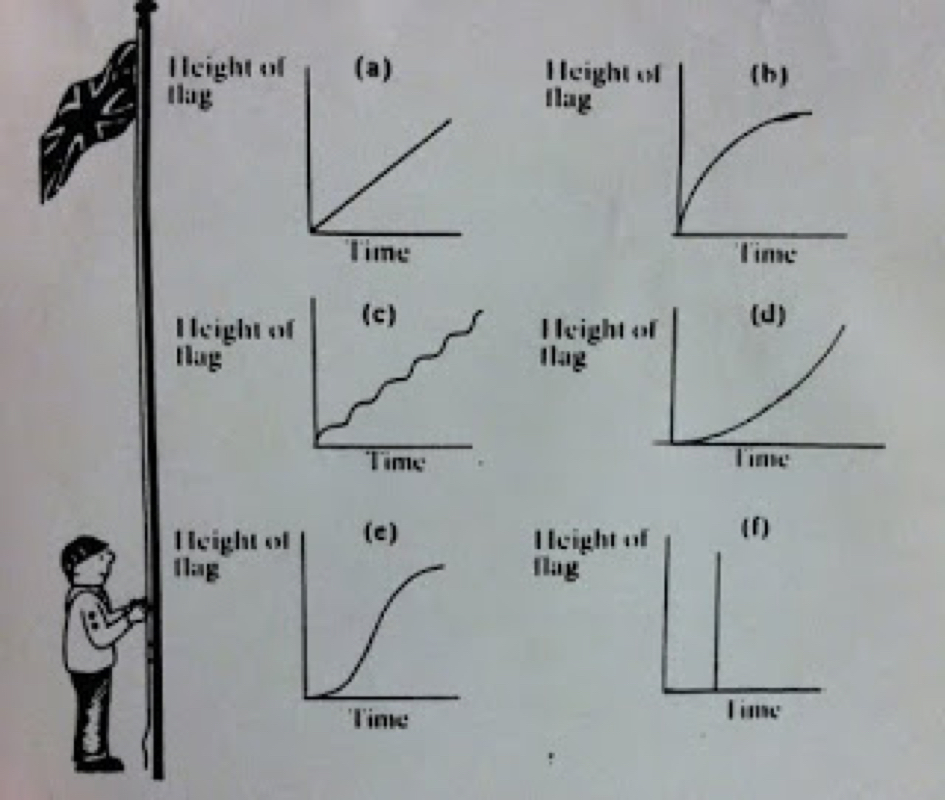
The graph a is close to a realistic representation of a flag being raised, the graph shows that the flag would be raised at a constant rate over time but the graph goes to infinity, that means the the flag would never stop being raised. The graph shows an identity function.
Graph B is close to realistic expect for the fact that at the start the flag is being raised even though time is not passing by. Over time the the flag is being raised at a constant speed until the flag reaches its peak where the graph levels out and time goes on but the the y value does not increase. This graph is represented by a square root function
Graph C shows that the boy scout would raise the flag for a little bit and then take a break, then raise the flag again and take another break, this would go on for an infinite amount of time.
Graph D represents that the flag is being raised over time and then the graph has a asymtope at a certain x value, that means that the x cannot get any bigger but the y value is still increasing. Time is not going by but the flag is being raised. Graph D shows an exponential function.
Graph E to me shows the most realistic graph of this situation, at the very beginning while the boy scout is getting the flag ready to raise, the x value you is getting bigger but the y is not, once the flag is ready to be raised the x grows constant with the y until it reaches the peak where then the y does not get any bigger but the x value goes on infinity.
Graph F is the graph that is least realistic, this graph shows that the flag is being raised without time going by. The graph is a vertical function or undefined slope so the y goes to infinity but the x does not change
 RSS Feed
