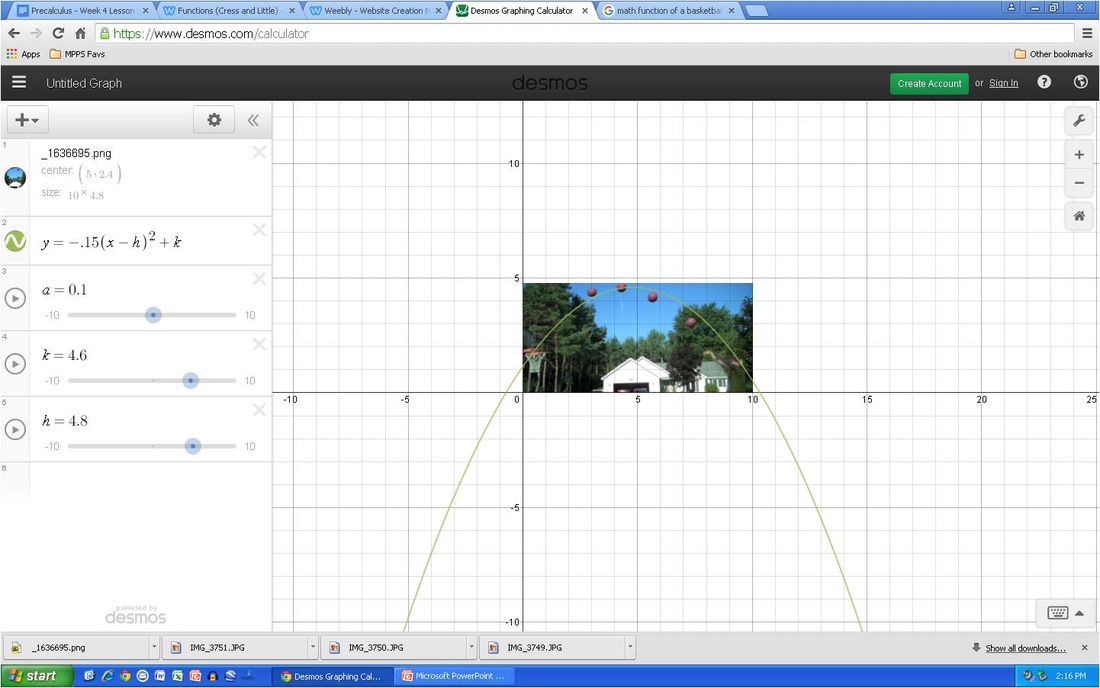
I can tell that this shot will go in due to the fact that the quadratic graph shows the ball falling through the hoop.
|
I can tell that this shot will go in due to the fact that the quadratic graph shows the ball falling through the hoop.
0 Comments
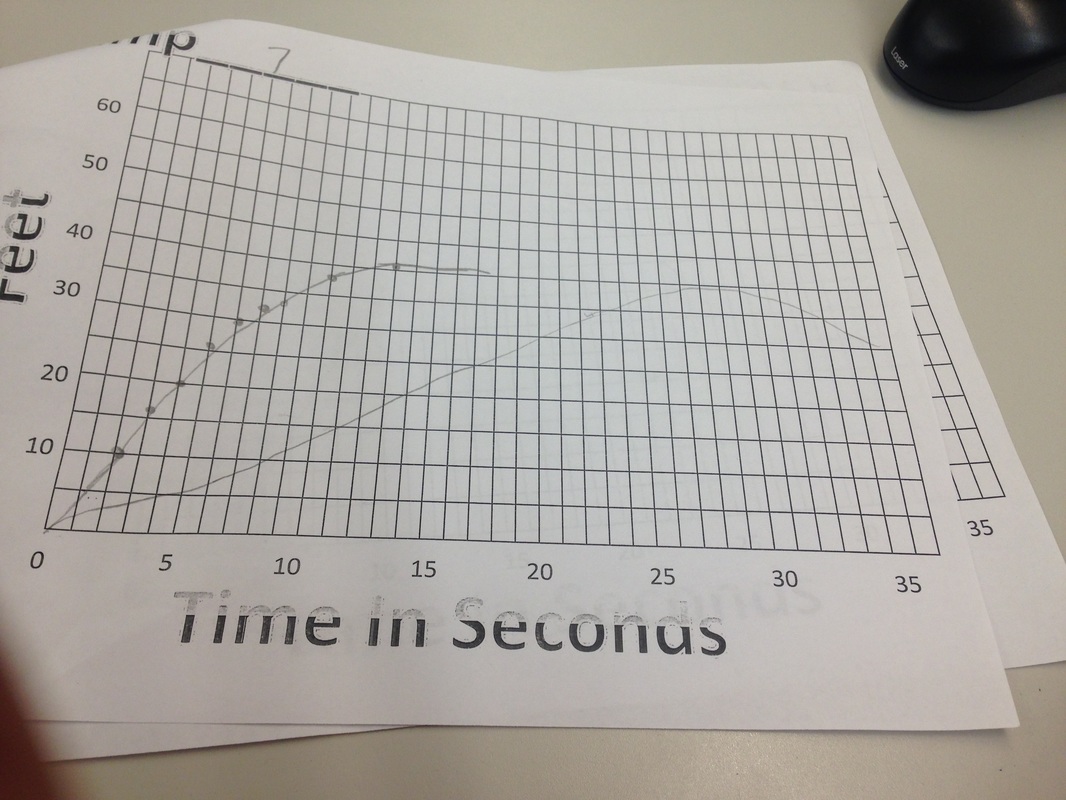
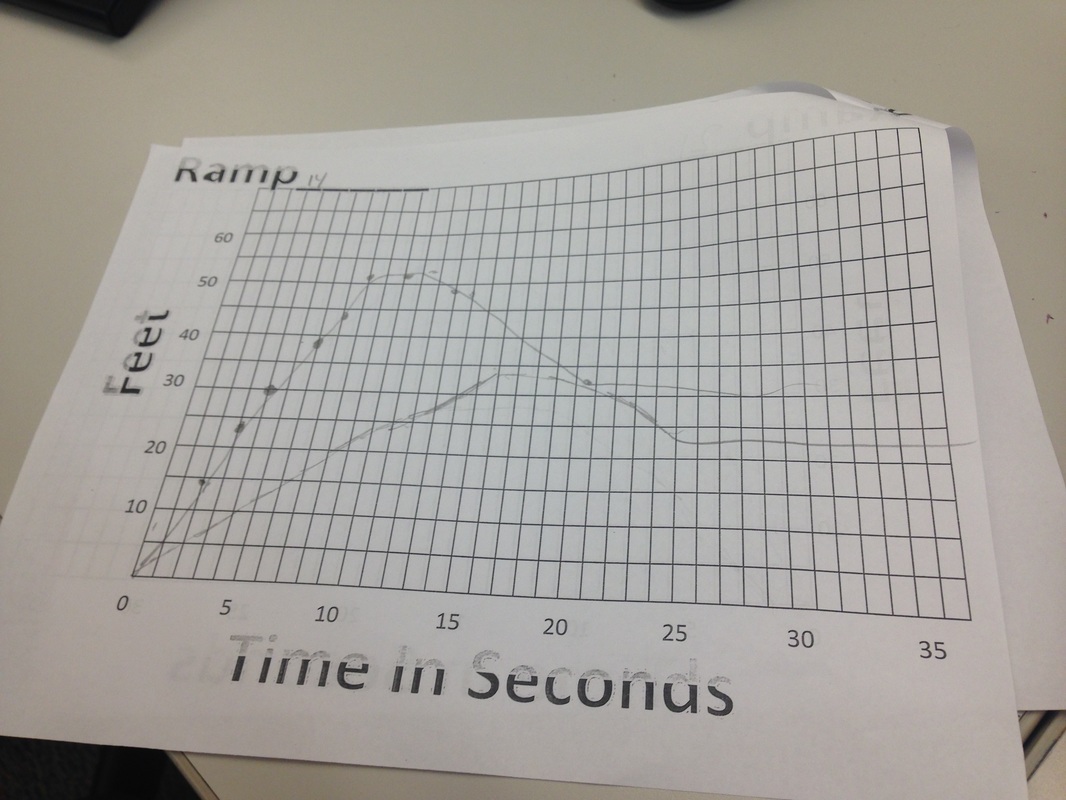
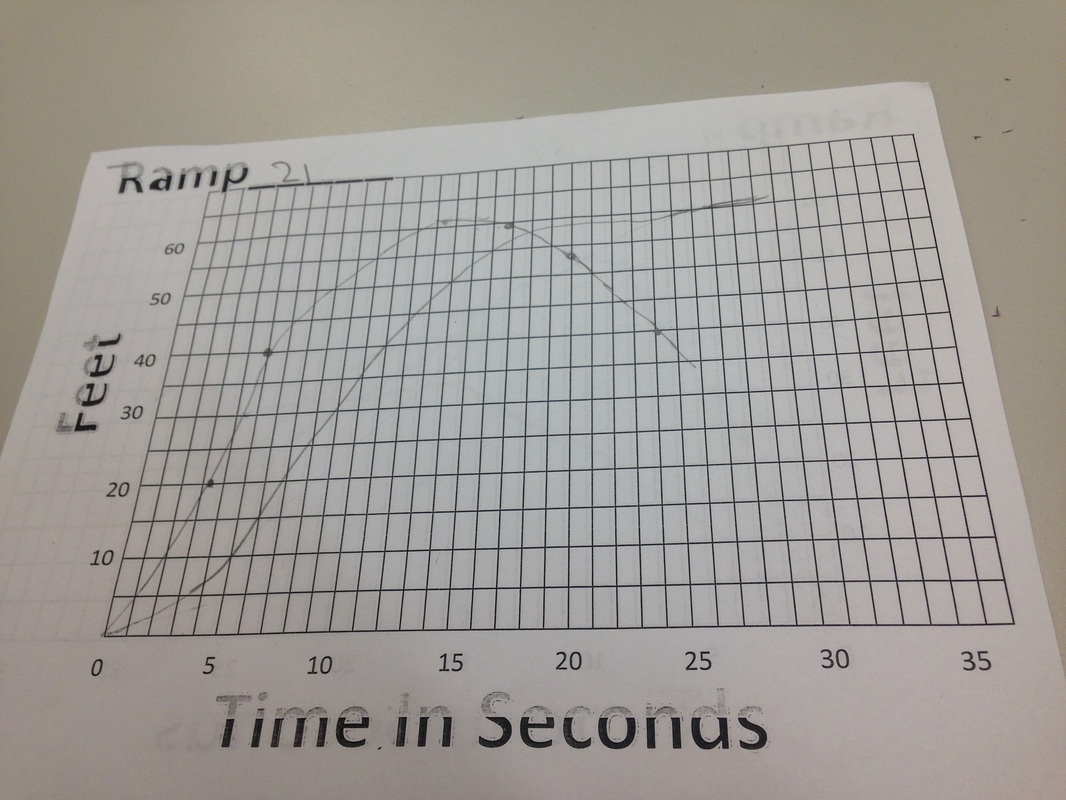
My original idea for the prediction was close to the real graph slope and overall appearance was very similar. The thing that I did not account for in my prediction is that the skateboard will go backwards when it stops moving forward so in my prediction the graph just levels out and time goes on but the skateboard does not move.Where in the actual graphs the skateboard goes backwards and the curve comes back down towards the x axis. The zeros in the graph represent where the skateboard is at Zero feet. The difference in the three graphs are the minimum and maximum the maximum y value is in the graph of the skateboard being let go for 21 Feet the reason is due to the fact that it has the most momentum to go the furthest. The zeros are all the same in the three graphs because the measurement started at 0 feet for all three.When the graphs slope is rising the fastest that means that it is falling the fasting which is due to the momentum of the skateboard which comes from falling from a higher height. When the graph is falling the fastest it means that it is going backwards quickly towards the Zero.
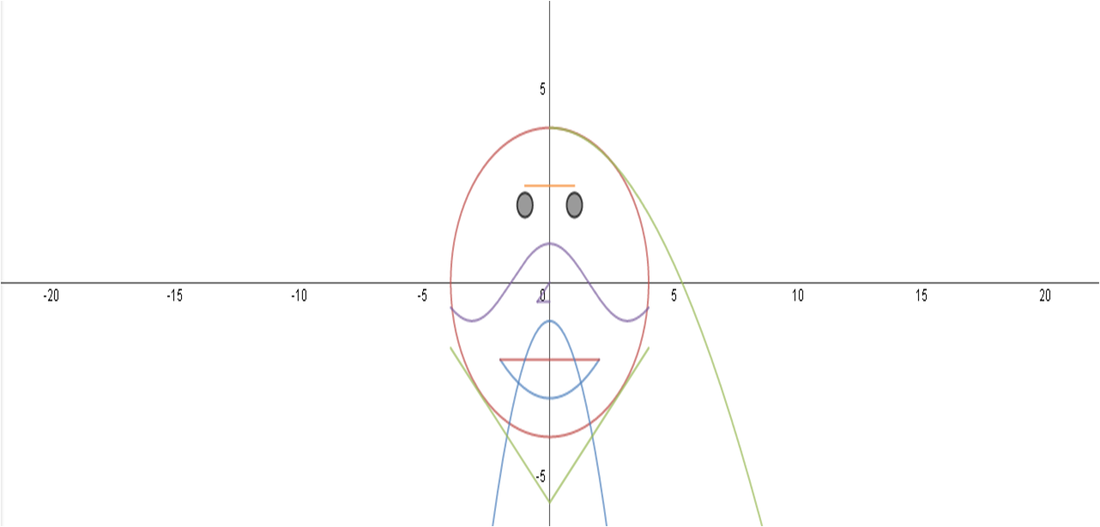 In this assignment we had a blank smile face and we had to make changes to it but using a base function and manipulating so that way it would move and fit the face how we would like it. The hardest part for me and the part that I learned were directly linked. The hardest part for me was how to make the function a certain size like for instance the hair, I could not get the hair to be where I wanted it. That is where what I learned comes into play, I learned that where you want to restrict a function too you need to put brackets and make a number less than x less than a number ex. 2<x<2. In this assignment I also learned how a function moves up and down and left and right.
The different functions that I used are, absolute value function, constant function, Sine function, quadratic function and a exponential function. The graph a is close to a realistic representation of a flag being raised, the graph shows that the flag would be raised at a constant rate over time but the graph goes to infinity, that means the the flag would never stop being raised. The graph shows an identity function. Graph B is close to realistic expect for the fact that at the start the flag is being raised even though time is not passing by. Over time the the flag is being raised at a constant speed until the flag reaches its peak where the graph levels out and time goes on but the the y value does not increase. This graph is represented by a square root function Graph C shows that the boy scout would raise the flag for a little bit and then take a break, then raise the flag again and take another break, this would go on for an infinite amount of time. Graph D represents that the flag is being raised over time and then the graph has a asymtope at a certain x value, that means that the x cannot get any bigger but the y value is still increasing. Time is not going by but the flag is being raised. Graph D shows an exponential function. Graph E to me shows the most realistic graph of this situation, at the very beginning while the boy scout is getting the flag ready to raise, the x value you is getting bigger but the y is not, once the flag is ready to be raised the x grows constant with the y until it reaches the peak where then the y does not get any bigger but the x value goes on infinity. Graph F is the graph that is least realistic, this graph shows that the flag is being raised without time going by. The graph is a vertical function or undefined slope so the y goes to infinity but the x does not change 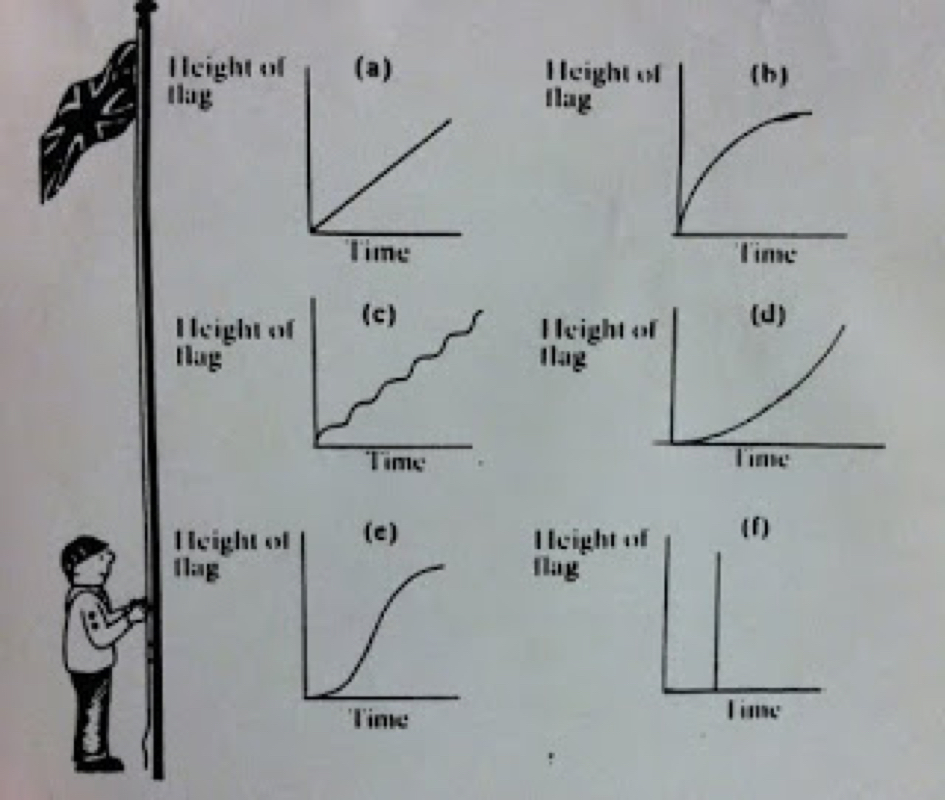 |
AuthorWrite something about yourself. No need to be fancy, just an overview. Archives
February 2016
Categories |
 RSS Feed
