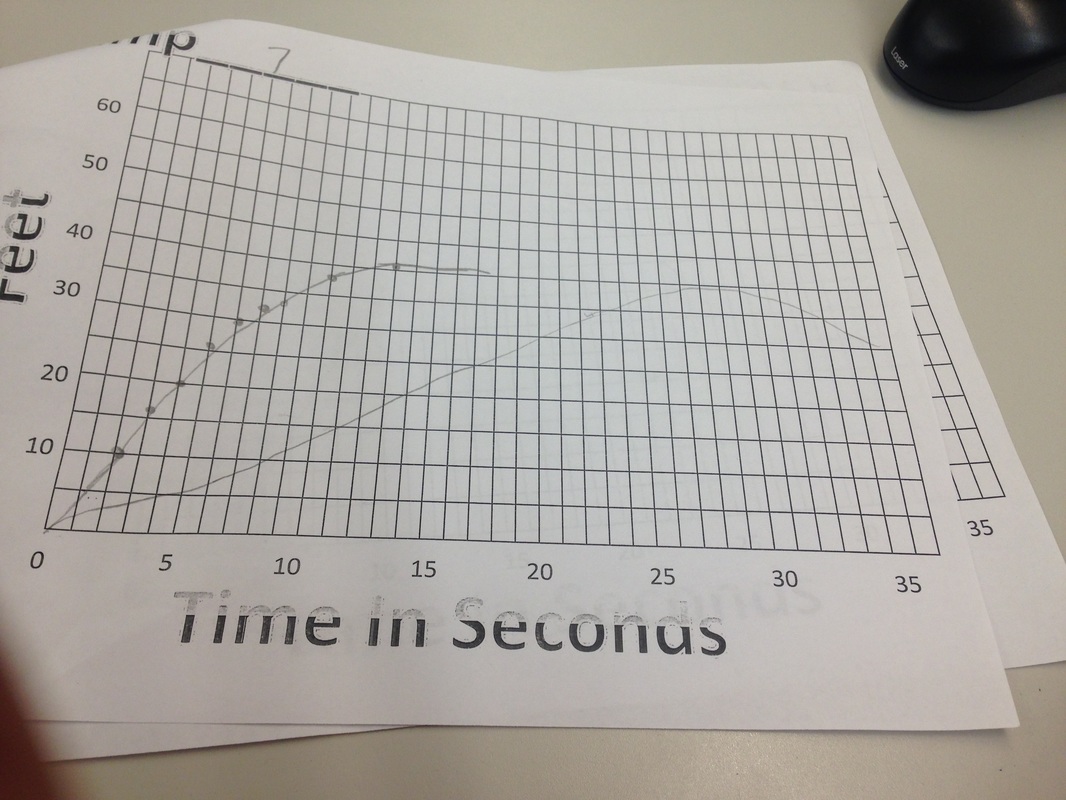
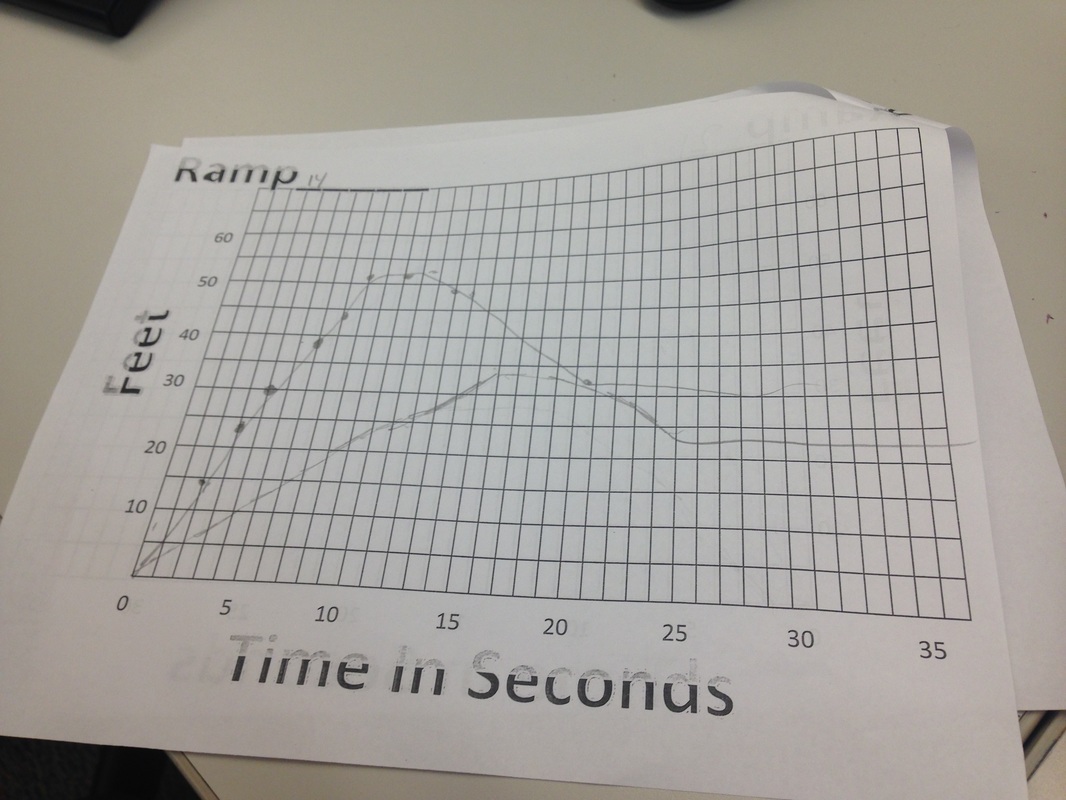
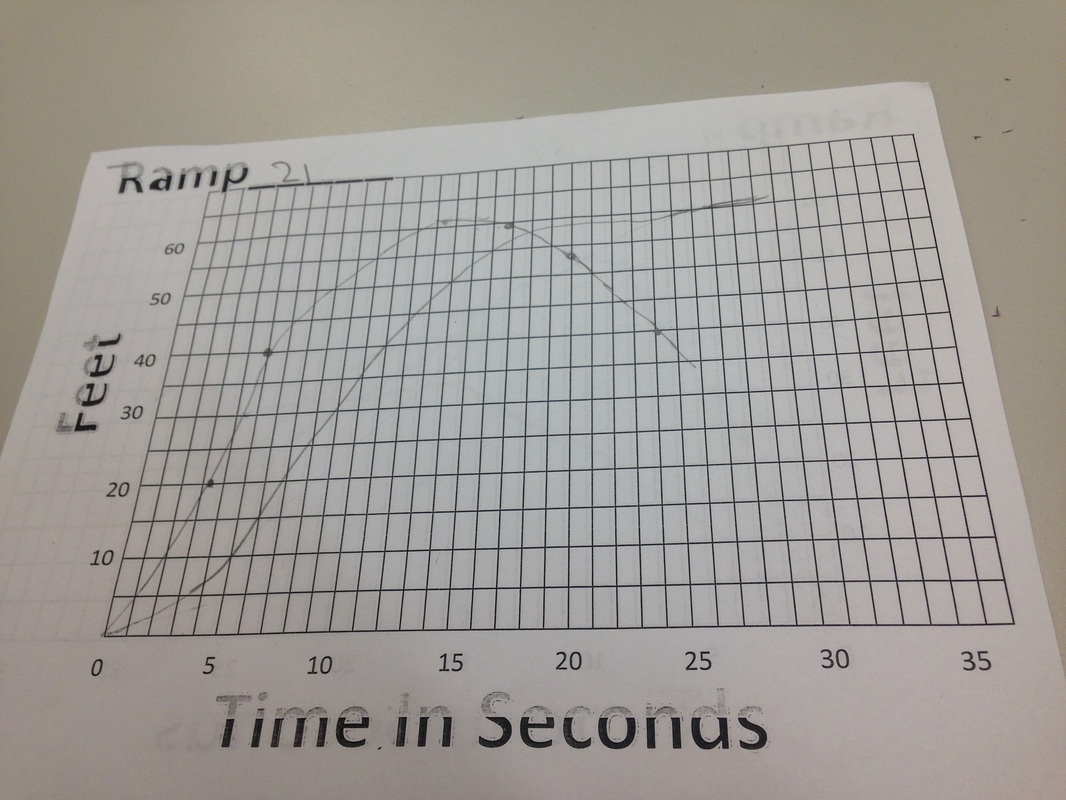
My original idea for the prediction was close to the real graph slope and overall appearance was very similar. The thing that I did not account for in my prediction is that the skateboard will go backwards when it stops moving forward so in my prediction the graph just levels out and time goes on but the skateboard does not move.Where in the actual graphs the skateboard goes backwards and the curve comes back down towards the x axis. The zeros in the graph represent where the skateboard is at Zero feet. The difference in the three graphs are the minimum and maximum the maximum y value is in the graph of the skateboard being let go for 21 Feet the reason is due to the fact that it has the most momentum to go the furthest. The zeros are all the same in the three graphs because the measurement started at 0 feet for all three.When the graphs slope is rising the fastest that means that it is falling the fasting which is due to the momentum of the skateboard which comes from falling from a higher height. When the graph is falling the fastest it means that it is going backwards quickly towards the Zero.
 |  |  |
 RSS Feed
